Biggest baddest bottlenecks for truck traffic in the USA

Created with my googlemaps.com

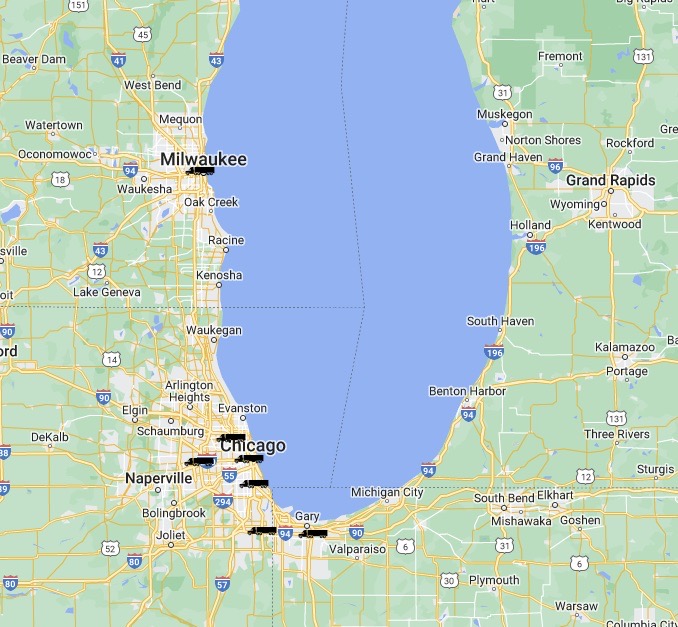
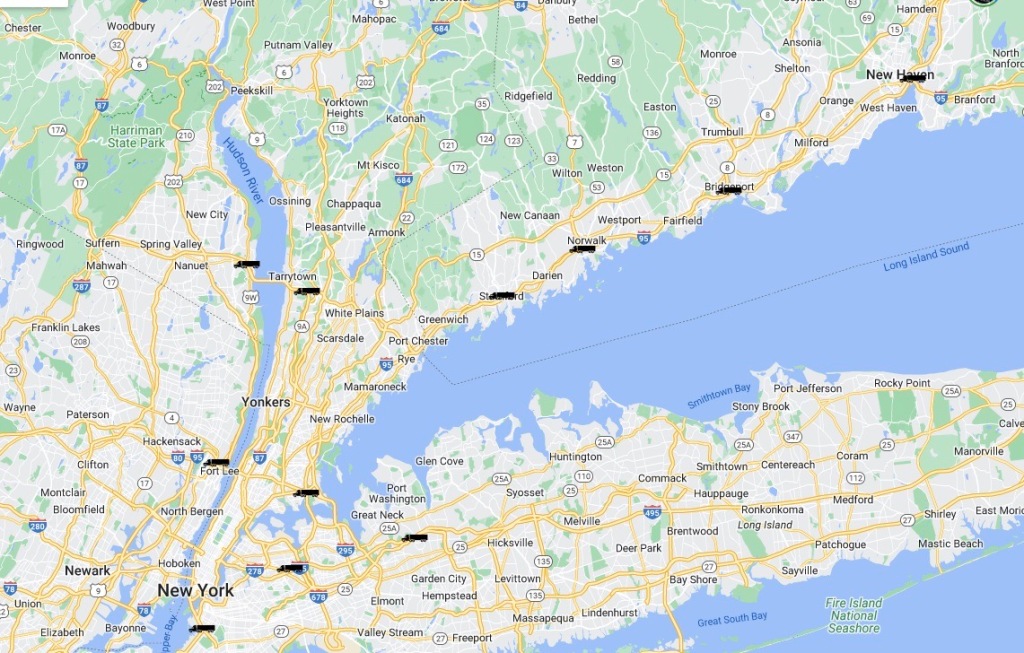
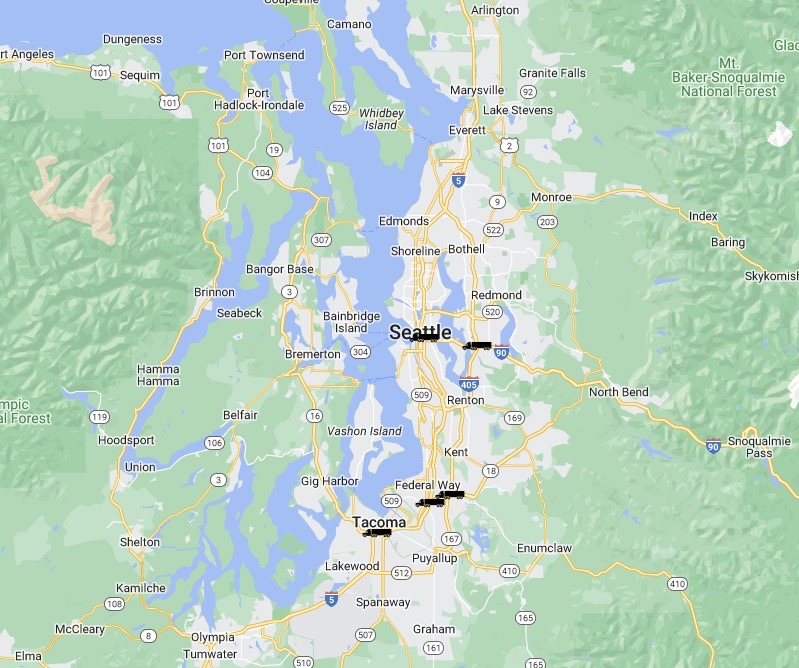
The map above and the list below identify the 100 worst trucking bottlenecks in the United States in 2023. Where the truck icons blend/blur together on the map, there are more bottlenecks in close proximity to one another. More detailed maps for six of the most congested regions are provided after the list. Anyone who has driven many of these routes can attest to the heavy truck traffic.

  1. Fort Lee, NJ: I-95 at SR 4
    2 Chicago, IL: I-294 at I-290/I-88 IL
    3 Houston, TX: I-45 at I-69/US 59
    4 Atlanta, GA: I-285 at I-85 (North)
    5 Atlanta, GA: I-20 at I-285 (West)
    6 Chicago, IL: I-290 at I-90/I-94
    7 Los Angeles, CA: SR 60 at SR 57
    8 Los Angeles, CA: I-710 at I-105
    9 Nashville, TN: I-24/I-40 at I-440 (East)
    10 San Bernardino, CA: I-10 at I-15
    11 Houston, TX: I-10 at I-45
    12 Chicago, IL: I-80 at I-94
    13 McDonough, GA: I-75
    14 Atlanta, GA: I-285 at SR 400
    15 Cincinnati, OH: I-71 at I-75
    16 Dallas, TX: I-45 at I-30 TX
    17 Atlanta, GA: I-20 at I-285 (East)
    18 Atlanta, GA: I-75 at I-285 (North)
    19 Houston, TX: I-45 at I-610 (North)
    20 Baton Rouge, LA: I-10 at I-110
    21 Hartford, CT: I-84 at I-91
    22 Chicago, IL: I-90 at I-94 (South)
    23 Denver, CO: I-70 at I-25
    24 Chicago, IL: I-90 at I-94 (North)
    25 Stamford, CT: I-95 CT
    26 Houston, TX: I-10 at I-610 (West)
    27 Brooklyn, NY: I-278 at Belt Parkway
    28 Portland, OR: I-5 at I-84
    29 Philadelphia, PA: I-76 at I-676
    30 Houston, TX: I-610 at US 290
    31 Vancouver, WA: I-5 at Columbia River
    32 Austin, TX: I-35
    33 St. Louis, MO: I-64/I-55 at I-44
    34 Providence, RI: I-95 at I-195
    35 Atlanta, GA: I-20 at I-75/I-85
    36 Queens, NY: I-495
    37 Nashville, TN: I-40 at I-65 (East)
    38 Philadelphia, PA: I-76 at US 1
    39 Chattanooga, TN: I-24 at US 27
    40 Oakland, CA: I-880 at I-238
    41 Corona, CA: I-15 at SR 91
    42 Gary, IN: I-65 at I-80
    43 Houston, TX: I-10 at I-610 (East)
    44 Philadelphia, PA: I-476 at I-95
    45 Denver, CO: I-25 at I-76
    46 Bronx, NY: I-678
    47 Detroit, MI: I-94 at I-75
    48 Norwalk, CT: I-95
    49 Seattle, WA: I-5 at I-90
    50 Minneapolis – St. Paul, MN: I-35E at I-94
    51 Nashville, TN: I-65 at I-24
    52 Denver, CO: I-70 at I-270
    53 Dallas, TX: US 75 at I-635
    54 Waterbury, CT: I-84 at SR 8
    55 Minneapolis – St. Paul, MN: I-35W at I-494
    56 Charlotte, NC: I-77 near Lake Norman NC
    57 Atlanta, GA: I-75 at I-675
    58 Los Angeles, CA: I-110 at I-105
    59 Chattanooga, TN: I-75 at I-24
    60 Atlanta, GA: I-75 at I-85
    61 Ft. Worth, TX: I-35W at I-30
    62 Charlotte, NC: I-77 at I-485 (South) NC
    63 Knoxville, TN: I-40/I-75 at I-140
    64 Kansas City, MO: I-70 at I-670 at US 71
    65 Charlotte, NC: I-85 at I-485 (West)
    66 Indianapolis, IN: I-465 at I-69
    67 Boston, MA: I-93 at SR 3
    68 Federal Way, WA: SR 18 at I-5
    69 Auburn, WA: SR 18 at SR 167
    70 Charleston, SC: I-26 at I-526
    71 Houston, TX: I-610 at I-69/US 59 (West)
    72 Knoxville, TN: I-40 at I-275
    73 Tampa, FL: I-4 at I-275
    74 Las Vegas, NV: I-15 at I-515
    75 Manhasset, NY: I-495 at Shelter Rock Road
    76 New Haven, CT: I-95 at I-91
    77 Stafford, VA: I-95
    78 Tacoma, WA: I-5 at I-705/SR 16
    79 Washington, DC: I-95 at I-495 (North)
    80 Philadelphia, PA: I-76 at I-476
    81 Houston, TX: I-10 at I-69/US 59
    82 Greenville, SC: I-85 at I-385
    83 Phoenix, AZ: I-17 at I-10
    84 Nyack, NY: I-287
    85 Oakland, CA: I-80 at I-580/I-880
    86 Bridgeport, CT: I-95 at SR 8/SR 25
    87 Indianapolis, IN: I-65 at I-70 (North)
    88 Seattle, WA: I-90 at I-405
    89 Washington, DC: I-495 at I-66
    90 Boston, MA: I-95 at I-90
    91 Houston, TX: I-45 at Sam Houston Tollway (North)
    92 Washington, DC: I-495 at I-270 (West)
    93 Los Angeles, CA: SR 91 at SR 55
    94 Milwaukee, WI: I-94/I-794 at I-43
    95 Louisville, KY: I-265 at I-64
    96 Elmsford, NY: I-287 at I-87
    97 Baltimore, MD: I-695 at I-70
    98 Minneapolis – St. Paul, MN: I-35W at I-94
    99 Boston, MA: I-95 at I-93 (North)
    100 Camden, NJ: I-76 at I-676

Below are maps of some of the cities with heavy concentrations of trucking bottlenecks. Both the Philadelphia and Washington-Baltimore areas also have five bottleneck areas.

Peace!

Atlanta-Chattanooga Region = 11
Chicago-Milwaukee Region = 7
Los Angeles Region = 6
Houston Region = 9
Greater New York City Region = 11
Seattle-Tacoma Region = 5

SOURCE:

Posted in business, cities, commerce, distribution, ecommerce, geography, highways, industry, infrastructure, land use, logistics, Maps, planning, spatial design, Statistics, traffic, transportation, Travel, trucking, urban planning | Tagged , , , , , , , , , , , , | Leave a comment

Scaling one the last remaining fire lookout towers in Illinois

At one time, there were 30 fire lookout towers in the Land of Lincoln. Sadly like many other states, they began to be disassembled and removed in the 1970s when technology and other resources began replacing humans as fire lookouts.

Today, there are but three left in the state — two in the far southern part of Illinois and one just east of the Mississippi River near Keithsburg. As a part of our sojourn across the country, we decided to stop and see the Big River State Forest Lookout Tower just south of Keithsburg – about 20 miles to the northeast of Burlington, Iowa — BTW be sure to stop in Burlington and see Aldo Leopold’s birthplace and boyhood home.

The 60-foot tall tower was erected in 1941 and is an Aermotor design from Chicago. Given its age, the tower is in remarkably good shape. It’s also the first one we’ve see with wooden steps and landings.

Looking up into the cabin towards its roo

Better yet, this was the first tower we’ve visited where we were allowed to climb all the way to the topped visit the 7′ x 7′ cabin. Mighty tight in there! Hard to image spending day after day up there in such a tiny cubicle, racially with all the equipment and such needed to properly perform your lookout tasks.

The Big River Fire Lookout is surrounded by a locked wooden fence, but with a short walk over to the state forest often, one can get a key to climb the tower. The caretaker was very kind, but keep in mind they are not always onsite, especially in the off season, so we were fortunate.

One last note. Despite the locked wooden fence surrounding the base of the tower, vandals still find a way to sneak in. As a result, when we were there, two windows were missing from the cabin. The caretaker indicated he’s replaced more windows than he can count over the years. Unfortunately, that is an all-too-common occurrence with many of our historic lookouts, as well as other historic sites and structures. One wishes that parents, as well as classes/programs in school would better teach civic responsibility and the importance of preserving our past.

Peace!

Posted in archaeology, architecture, civics, ecosystems, engineering, environment, forests, fun, geography, government, historic preservation, history, infrastructure, land use, lookouts, natural history, nature, pictures, place names, product design, recreation, schools, skylines, spatial design, Statistics, topography, tourism, Travel, Wilderness, wildfire, Wildlife | Tagged , , , , , , , , , , | Leave a comment

A living art museum amid ghost town ruins

We stopped by the ghost town of Colmor, New Mexico today (Sunday April 21) and were not only intrigued by the haunting remains of this small town, but were absolutely astounded by the beautiful graffiti art painted on the remaining walls of the former elementary school. It was essentially a living outdoor art museum amidst the ruins of a ghost town.

Impressive art amidst the town’s ruins

Colmor was founded in 1887 on the far western edge of the High Plains of New Mexico. The town has been in decline since it was bypassed first by U.S. 85 and later by I-25. The closure of its post office in 1963 pretty much rung the death knell for Colmor.

Today, there are a number of interesting dwellings, structures, and some abandoned classic vehicles in Colmor. But what really grabbed our attention were the stunning graffiti art images painted on the inside and outside walls of what used to the the town’s elementary school and a nearby structure.. Samples of these images are included throughout this post. Several poignant quotes (and/or titles) were also included:

“End of the Trail”

“What once was…”

“One day, a little puppy could save your life.”

“The bones of classic Americana”

The only thing we could not figure out is how many artists worked to create these images. One name was listed that appears to read “Hindue_ner” (sp?) along with the date of 2021s. The cowboy image appears to have similar name next to it – “Hindue.” Whether any of these are related to the renown freight car graffiti artist Hindue GTB is unclear. Regardless whether they were painted by one person or more, many of these works should displayed in museums.

If you are ever traveling along I-25 south of Raton and north of Las Vegas, New Mexico, consider getting off the highway at Exit 404 and wandering over to Old U.S. 85. Colmor is situated a few miles to the south-southeast of the exit. Here are two maps to help with general directions from I-25.

Be sure to look for Colmor’s location online ahead of time, because there are no longer any signs pointing the way to the town from Old U.S. 85, and it is set in a slight depression of land next to the BNSF Railroad tracks. If you like ghost towns and/or graffiti art, Colmor is worth the brief side excursion.

Peace!

Posted in adaptive reuse, art, Cars, cities, Communications, culture, fun, ghost towns, highways, historic preservation, history, infrastructure, land use, pictures, place names, placemaking, schools, spatial design, toponymy, tourism, transportation, Travel | Tagged , , , , , , , , , , , , , | Leave a comment

Frozen fun: The ascent of ice climbing parks

As spring moves into full bloom, one might wonder why we are posting a piece on ice climbing parks? Well, human-made ice climbing parks have successfully filled a niche for smaller communities that in the past have largely shut down for the winter months due to the lack of outdoor recreation opportunities or drier climate conditions being prevalent there. For larger cities, local ice climbing options provide residents and visitors with another outdoor activity during winter.

“My goal is to fill every lodge in town and have the restaurants stay open all winter long,” said Ben Hake, Lake City’s Parks and Recreation director. Winter sales tax revenue has risen by nearly 40% since 2019. Hake’s goal is to eventually cover a mile of the canyon in ice, turning Lake City into a climber’s paradise.”

Source: hcn.org

With the advent of these parks, ice climbing enthusiasts no longer have to drive many hours to remote waterfalls and icy rock outcroppings, nor pay adventure tour groups, as “farming” of an ice park locally has been shown to be a successful endeavor.

As a result, park and recreation departments located in higher latitudes and altitudes may want to explore this option, especially if there’s nifty cliff, bluff, quarry, or wall of rock nearby to create such an exciting climb. Even without such varied topography, innovative folks in areas of level landscapes have found unique options. Here are some examples:

_______

Ouray Ice Park, Colorado: First established in 1994, Ouray is considered by many to be the “Ice Climbing Capital” of the country. The town has the largest human-made ice climbing park in North America, with more than 125 different climbing routes, some reaching as high as 130 feet. The park is located in the scenic Uncompahgre Gorge and is known for its reliable ice conditions, thanks to the added irrigation system.

Source:; ourayicepark.com

“During the winter of 2021-’22, the Ouray Ice Park pumped $18 million into Ouray County.”

Source: hcn.com
Example of one segment of ice climbing options in Ouray – Source: ourayicepark.com

Lake City Ice Park, Colorado: Another great option in Colorado, as this park offers more than 75 routes for all skill levels with climbing reaching up to 170 feet in height. The proximity of the city’s water tower to the climbing park made the creation of the ice park through ice farming all the more convenient. Lake City has also found that the ice park has help lift local businesses out of the winter doldrums by attracting climbers to the community, as downtown is just a block away.

Source: lakecityice.com

Sandstone Ice Park at Robinson Quarry, Minnesota: This ice park is located near Sandstone, Minnesota and is a great option for area/regional climbers. The park offers a variety of top rope and lead routes, as well as clinics and guided tours. The highest climb in this former quarry is 90 feet.

Source: sandstoneicefest.com

Winona Ice Park, Minnesota: Now identified as the nation’s second largest ice park with 100 climbing routes, this location allows climbers to explore portions of Sugar Loaf Bluff, which overlooks the Mississippi River. The park was established as a joint venture between the City of Winona and the Recreation Alliance an has climbs ranging up to 100 feet in height.

Source: visitwinona.com

Teton Ice Park, Wyoming: Located at one of the resorts in Jackson Hole, this park offers climbs for a variety of skill levels on ice up to 40 feet in height.

Source: theholeconcierge.com

Beyond these dedicated parks with steep terrain, the St. Boniface section of Winnipeg, Manitoba establishes a 66-foot tall ice climbing tower each winter; Edmonton, Alberta has a 60-foot tall ice-climbing wall in Fan Park; and several imaginative folks in northeastern Iowa annually create ice silos ranging between 55 and 70 feet tall for climbing enthusiasts. Yes, you read that correctly – ice silos!

Ice silo climbing in Iowa – Source: today.com
Ice tower in St. Boniface (Winnipeg), Manitoba – Source: globeguide.ca

Given this surge in local ice climbing opportunities, other communities may want to consider creating such local recreational options as a way of promoting healthy exercise during the winter months. Several places come to mind where the topography would be well-suited for creating an ice climbing park, including the gorges of Ithaca, New York; the ledges of Grand Ledge, Michigan; the mesa cliffs of Los Alamos, New Mexico; abandoned limestone quarries near Bedford, Indiana (provided its cold enough there) and the rocky gulches of Creede, Colorado.

Perhaps, if your community gets the ball rolling now (in spring), a new ice climbing park could be operational for next winter. Peace!

SOURCES:

Posted in adaptive reuse, Arctic, cities, climate, economic development, engineering, entertainment, fitness, fun, geography, health, infrastructure, land use, Maps, mountains, natural history, nature, placemaking, planning, recreation, seasons, sports, technology, third places, topography, tourism, Trade, Travel, urban planning, water, weather | Tagged , , , , , , , , , , , , , , , , , , , , , , , , | Leave a comment

Take a [Late Night Drive Home] to alternative rock bliss

Andre Portillo, Juan “Ockz” Vargas, Brian Dolan, and Freddy Baca – Source: latenightdrivehome.com

So far, 2024 has been a wonderful year for discovering new alternative rock music. First Been Stellar and now a terrific band out of the El Paso, Texas area. In both cases. I have to thank Britain’s NME (New Music Express) for the kind introduction.

Source: latenightdrivehome.com

Late Night Drive Home has released two EPs, a full length album, and quite a few singles. Prior to their 2024 EP, they largely self-recorded and released their music. To this music aficionado, that’s impressive.

Both their sonic and rhythmic guitar riffs are very infectious, dreamy, and captivating. While their emotive lyrics quickly touch your heart. All I know is I want to hear more and more music from this band! Hopefully a second full-length album will be forthcoming soon.

Here’s a list of my favorite tracks released by Late Night Drive Home to date:

“Sleeping in Cars” – such a great rock song!!!!!

“How To Be Normal” – beautifully introspective

“Perfect Strangers” – a great love song

“Talk To Me” – haven’t we all been there?

“With a Dream of You” – touches your heart

“Nostalgic Love Rock”

“Stress Relief” – their first big hit

“Believe Me” – a zooming rocker!

“Over The Garden”

“We’re Nobody”

“Feeling Grey” – don’t we all feel this way now and then?

“Best Friend” – vibes of The Cure for sure!

“Under Supervision”

“Euphoria”

I’m looking forward to hearing more great music from this talented quartet. Hopefully more and more music fans will stay up late to hear them on their drive home too. Peace!

Source: first-avenue.com
Posted in art, Communications, culture, entertainment, fun, history, music, music reviews, pictures, songs, video, writing | Tagged , , , , , , , , , , , , , | Leave a comment

India’s longest road/highway land tunnels

Source: empowerias.com

The following list identifies the longest roadway land tunnels in India. Underwater tunnels are not included. As additional tunnels are constructed or become known, they will be added to the list. As always, any additions, corrections, or suggestions are most welcome. Peace!

Atal Tunnel (2020) – Source: nepaldrives.com
  1. Zojila Pass (2024) –  Jammu and Kashmir = 14.31 km/8.86 miles – *some websites list the length at 14.15 km)

2. Chenani-Nashri (Dr. Syama Prasad Mookerjee) (2017) – Jammu and Kashmir = 9.28 km/5.77 miles

3. Atal Road (2020) – Himachal Pradesh = 9.02 km/5.61 miles

4. Banihal Qazigund (2021) – Jammu and Kashmir = 8.45 km/5.25 miles

5. Orange Gate-Marine Drive (uc) Mumbai = 4.46 km/2.77 miles

6. Silyara (uc) – Uttarakhand = 4.35km/2.7 miles – *construction status unknown since partial collapse in fall 2023

7. Borali BG (2015) – Assam = 3.2 km/2.00 miles

8. Karwar (1998) – Karnataka = 2.9 km/1.80 miles

9. Jawahar (1956) – Jammu and Kashmir = 2.85 km/1.78 miles

10. Ghat Ki Guni (2013) – Jaipur = 2.8 km/1.74 miles

11. Nilgrar 2 (2024) – Jammu and Kashmir = 1.93 km/1.2 miles

12. Kamshet-West (2000) – Maharashtra = 1.84 km/1.15 miles

13. Bhatan North (2000) – Mimbai-Pune Expressway = 1.09 km/0.67 miles

14. Bhutan South (2000) – Mimbai-Pune Expressway = 1.05 km/0.65 miles

15. Kamshet-1 South (2000)- Mimbai-Pune Expressway = 0.97 km/0.60 miles

16. Kamshet-1 North (2002) – Mimbai-Pune Expressway = 0.94 km/0.58 miles

17. Nilgrar 1 (2024) –  Jammu and Kashmir = 0.43 km/0.27 miles

18. Khandala South (2002) – Mimbai-Pune Expressway = 0.36 km/0.22 miles

19. Madap South (2000) – Mimbai-Pune Expressway = 0.35 km/0.22 miles

20. Khandala North (2002) – Mimbai-Pune Expressway = 0.32 km/0.20 miles

21. Madap North (2000) – Mimbai-Pune Expressway = 0.30 km/0.18 miles

22. Adoshi (2002) – Mimbai-Pune Expressway = 0.23 km/0.14 miles

23. Kamshet-2 North (2002) – Mimbai-Pune Expressway = 0.19 km/0.12 miles

24. Kamshet-2 South (2002) – Mimbai-Pune Expressway = 0.17 km/0.10 miles

Orange Gate-Marine Drive Tunnel Route (Yellow) – Source: twitter.com

SOURCES:

Source: walkthroughindia.com
Posted in Asia, Cars, cities, economic development, engineering, highways, history, India, infrastructure, land use, mountains, pictures, planning, Statistics, topography, tourism, Trade, traffic, transportation, Travel, trucking, tunnels | Tagged , , , , , , , , , | Leave a comment

Morenci: A look inside America’s largest copper mine

We had the opportunity over the past weekend to travel to and through parts of Southeast Arizona. While returning, we drove along U.S. 191 through the ginormous Morenci Copper Mine — the largest in the United States. This complex is simply mind-blowing for its size, scale, and scope!

Source: mygooglemaps.com

First established as an underground mine in 1871, the Morenci Mine now occupies some 80 square miles (per viewpoint signage) or nearly four Manhattan Islands! Visitors can clearly see the mine when approaching the Clifton-Morenci area from many miles away. And driving through it on U.S. 191 takes approximately 10 miles, including passing under at least three tunnels or overpasses for the steady stream of Caterpillar 793 Mining Trucks carrying loads or returning for a refill (even a Sunday morning). By the way – Each truck can carry 240 tons per trip (per viewpoint signage).

You cannot help but be amazed (and impressed) by the continuous symmetry of the mining operation(s). At the same time, one can feel rather alarmed by our mechanized power over Mother Nature — in large part to fulfill our consumerist desires (or needs) for more electronic gadgets. However, reports indicate that available copper resources at the Morenci Mine will be exhausted by the mid-2040s.

What a future mine closure in two decades means for the 3,933 residents of Clifton and the 2,208 folks in Morenci is hard to fully comprehend. Many are employees of the mine or their dependents, not to mention the workers who commute from further afield in Greenlee County and surrounding areas. Certainly, there will be some employed for reclamation of this vast site. There is also a relatively new copper mine (since 2007) operating some 47 miles to the southwest of Morenci in Safford, Arizona

Across the American West are a plethora of mining towns that have faced boom and bust cycles before. Some have survived…many have not. How Clifton and Morenci will fare post closure remains to be seen. Completely retrofitting a local economy is a daunting task for any community. Doing it amid a noticeably altered landscape has to be more difficult.

Hopefully, over time, these two towns will be able to navigate the upcoming changes successfully and find renewed purposes for themselves. Fortunately, they are situated in a lovely part of Arizona and along two of America’s most scenic roadway corridors — U.S. 191 (Coronado Trail) through the Apache-Sitegreaves National Forests and AZ 78 to the east of Clifton towards the Gila National Forest and the Mogollon Mountains in New Mexico.

Stunning mountainous beauty to the north of Clifton-Morenci on U.S. 191

Furthermore, there are a number of great examples of rediscovered and revitalized mining towns to provide Clifton and Morenci with guidance — wonderful places such as Bisbee, Arizona; Creede, Colorado; Leadville, Colorado; and Madrid, New Mexico to name just a few.

Peace!

Gorgeous mountain vistas east of Clifton on AZ 78

SOURCES:

Posted in adaptive reuse, art, business, cities, commerce, consumerism, culture, economic development, ecosystems, engineering, environment, forests, geography, Geology, ghost towns, historic preservation, history, humanity, infrastructure, land use, Maps, Mining, mountains, natural history, nature, pictures, planning, revitalization, spatial design, Statistics, topography, tourism, Travel, tunnels, urban planning | Tagged , , , , , , , , , , , , , , , , , , , , | Leave a comment

“Storyliving towns” – A new dystopian blueprint?

As if Americans weren’t already overwhelmed with rampant commercialism, marketers have now decided to bring Storyliving towns to our front doorsteps.

“Ding-dong! Congratulations Mr. & Ms. America. Now, you can live in an alternate universe among your cartoon friends and dream your life away in a Fantasyland…provided you can afford the price.”

Storyliving towns sound like the ultimate denial of reality in a nation that has addicted itself with “fake” everything from plastic trees to faux news to serial-lying politicians. Beyond that, why would adults 55+ in age even want to reside in Disney character-themed housing in the first place?

This blog author loved the Jetsons as a kid, but that doesn’t mean I would want to reside in a Jetsons theme park…though admittedly, a flying car would be awesome. And Astro was a very cool dog. Hmmm? Moving on…

Source: vistapointe.net

To date, two storyliving towns are in various stages of creation here in the United States. They are Cotino, California and Asteria, North Carolina. Each raises both intriguing planning issues to consider.

Cotino – Source: storylivingbydisney.com
  • Cotino, California– 2,000 planned homes in a gated community in the Mojave Desert city of Rancho Mirage, California. Here are brief summaries of initial planning concerns related to Cotino
  • Why create another fake oasis of green and blue in the desert during an era of global warming, climate change, and water shortages?
  • Why not redevelop a brownfield site (or part of one) instead of promoting more sprawl?
  • Why build a new community in an ecologically-sensitive place like the desert?
  • Why not design the community as a living model for the benefits of xeriscaping?
  • Why emphasize just single-family centered housing? Condominiums aren’t planned until sometime in the future.
  • Where is the housing affordability with homes starting a $1 million?
  • Will there be a continuing, long-term interest in such a specialized housing developments? And if not, will these homes hold their resale value over time?
  • Where is the inclusiveness if the community only includes those ages 55 and up?

“Cotino offers superfans a place to live out their wildest dreams; a chance to live in a Disney movie “where the story is all about you”. It will feature a clubhouse inspired by the futuristic mansion from Incredibles 2, where neighbours can bond over Disney-themed art lessons, enjoy dinners inspired by Disney stories and join family days with Disney-related activities.”

Source: theguardian.com
  • Asteria, North Carolina – located 33 miles west of Raleigh in Pittsboro will include 4,000 new homes. This town will include both single and multiple-family housing, trails, and other amenities for residents 55 and older.
Asteria – Source: bizjournals.com

Even if the Asteria were to be built in a compact style, dropping 4,000 new residences onto a town of approximately 4,500 (2020 Census) is going to create some havoc. Planning concerns and questions beyond those applicable from the Cotino list, include:

  • Why a car-centric town in a place the have limited transit services?
  • Is the infrastructure there to support Asteria? Water? Sewer? Police? Fire? Emergency Services? Local roads? Hospitals? Etc, etc, etc?
  • Why add 4,000 new homes in a town of 4,500 when larger markets are nearby?
  • No mention of businesses or services been provided in Asteria. A town of 4,500 people definitely does NOT have the quantity of businesses, retailers, and services to accommodate such a massive influx or new people. As a result, traffic will be going all over the place, especially to/from Raleigh, Cary, Chapel Hill, and Durham.
  • Can you say “sprawlsville?” As new businesses flock to Pittsboro to support the influx of residents, it’s highly unlikely they will be developed in a coherent and organized manner, especially during the initial rush.
  • Can the existing main routes between Raleigh and Pittsboro or Chapel Hill and Pittsboro even begin to handle such an enormous increase in traffic?

Non-planning Concerns

One has to wonder if there really are that many Disney character superfans above the age of 55 to populate these two communities? If there is, that’s something of a concern in itself. First, the fact that some people are so addicted to animated cartoon characters that at the age of 55+, they are willing to plunk down more than a million bucks to live in place swarming with them seems _____ (fill in the blank).

Second, don’t these potential residents have more important things to do than being fully immersed in cartoon characters and corporate branding promotions in the guise of art lessons? Maybe these folks should take some of that excess time and money to improve their local community? Help the homeless? Get outside and exercise? Donate to help feed starving Gazans? Volunteer for the Peace Corps? Something other than being fully consumed by marketing and branding.

It’s one thing to spend a week or two in a theme park, at a hotel, or on a cruise, but living, eating and breathing it all day, everyday?

Conclusion

Only time will tell if the storyliving towns of Cotino and Asteria are successful. One has to assume that the bean counters and consumer psychologists have done their due diligence and found there is an untapped market for such places. If so, that says something about the American psyche. Something, in the grand scheme of things, we should not be proud of as a society.

Peace!

Posted in advertising, Alternative transportation, branding, business, Cars, cartoons, cities, civics, climate change, commerce, consumerism, culture, demographics, density, deserts, economics, ecosystems, entertainment, environment, film, fitness, futurism, health, highways, history, industry, land use, landscape architecture, marketing, money, movies, music, nature, opinion, pictures, placemaking, planning, population, product design, revitalization, shopping, spatial design, sprawl, Statistics, sustainability, tourism, traffic, trails, transit, transportation, Travel, urban design, urban planning, visual pollution, walking, water, water conservation, xeriscaping, zoning | Tagged , , , , , , , , , , , , , , , , , , , , , | Leave a comment

The world’s wildest roundabout is below the ocean!

The tunnel and roundabout include illuminated artwork – Source: jobbiecrew.com

Eysturoyartunnilin (Eysturoy Tunnel) was completed in 2020 and connects three separate islands in the Faroe Islands archipelago situated in the North Atlantic north of the United Kingdom approximately midway between Iceland and Norway. An autonomous part of Denmark, this island chain now lays claim to have the world’s only undersea roundabout! This amazing bit of infrastructure is located 238 feet below the surface of the ocean!

Source: guidetofaroeislands.fo

But that’s not the only wild bit of data. The entire tunnel is seven (7) miles long and at its deepest point is more than 620 feet below the surface.

So, the next time you hear or read about someone complaining about roundabouts, recommend they visit the Faroe Islands for a real education on the proper use of and appreciation for roundabouts. Remember, the adventure is at least half of the fun!

Peace!

Posted in architecture, art, Cars, commerce, economic development, engineering, environment, Europe, fun, geography, Geology, highways, history, infrastructure, land use, Maps, pictures, placemaking, planning, scenic byways, Statistics, technology, topography, tourism, traffic, transportation, Travel, tunnels, water | Tagged , , , , , , , , , , , , , , , | Leave a comment

The 130+ longest underwater highway tunnels in the world

When it became apparent back in 2014 that a list of underwater highway tunnels by order of their length could not be found on the internet, I decided to put one together. This 2024 rewrite is meant to be a work in progress, so if you know of additional underwater highway tunnels (open, under construction, or planned) that have been missed, please feel free to pass them along. Newly added tunnels to the list are shown in bold. As can be seen, there has been and still is quite a boom in underwater tunnel construction.

Boknafjord/Rogfast tunnel project – Source: en.wikipedia.org

Some of the numerical differences in this list from the previous one resulted from new projects, design changes, more information becoming available, and clearer project descriptions since 2014. Updates to the list will be made regularly. Peace!

(uc) – under construction with completion date unknown

(prop) – proposed

(?) – status unclear – more information is needed

The list provides the name of the tunnel, the year of completion in parenthesis, the city/nation and total tunnel length.

  1. Boknafjord/Rogfast (2033) – Norway = 88,583 feet
  2. Fehmarnbelt (2029) – Germany to Denmark = 58,608 feet
  3. Second Qingdao Jiaozhou Bay (uc) – Qingdao City, China = 52,133 feet
  4. Brahmaputra (uc) – Gohpur, India = 48,720 feet
  5. Ryfast (2020) – Stavanger, Norway = 46,904 feet
  6. Eysturoyartunnilin (2020) – Faroe Islands = 36,432 feet
  7. Sandoyartunnilin (2023) – Faroe Islands = 35,384 feet
  8. Taihu (2022) – Lake Taihu, China = 35,112 feet 
  9. Norðoyatunnilin (2006) – Faroe Islands = 32,736 feet
  10. Tokyo Bay (1997) – Tokyo, Japan = 31,498 feet
  11. Xiamen West (?) – Xiamen, China = 29,627 feet
  12. Shanghai Yangtze River (2009) – Shanghai, China = 29,040 feet
  13. Bomlafjord (2000) – Stord, Norway = 25,952 feet
  14. Eiksund (2008) – Volda, Norway = 25,547 feet
  15. Kamoy (2013) – Norway = 25,322 feet
  16. Oslofjord (2000) – Oslo, Norway = 23,787 feet
  17. Penang Undersea (2025) – Penang, Malaysia = 23,622 feet
  18. Nordkapp (1999) – Nordkapp, Norway = 22,704 feet
  19. Boryeong (2022) – Daecheon, South Korea = 22,638 feet
  20. Westerschelde (2003) – Netherlands = 21,655 feet
  21. Great Istanbul (2028) – Istanbul, Turkey = 21,325 feet
  22. Western Harbour (2026) – Sydney, Australia = 20,997 feet
  23. Qingdao Jiaozhou Bay (2011) – Qingdao City, China = 20,238 feet
  24. Byfjord (1992) – Stavanger, Norway = 19,329 feet
  25. Hvalfjörður (1998) – Reykjavik, Iceland = 18,929 feet
  26. Finnoy (2009) – Norway = 18,912 feet
  27. Atlantehav (2009) – Norway = 18,785 feet
  28. Dublin Port (2006) – Dublin, Ireland =18,702 feet
  29. Hitra (1994) – Hitra, Norway = 18,572 feet
  30. Hundvåg (2020) – Stavanger, Norway = 18,045 feet
  31. Froya (2000) – Norway = 17,400 feet
  32. Hongmei Road South (2015) – Shanghai, China = 17,258 feet
  33. Freifjord (1992) – Norway = 16,682 feet
  34. Vagatunnilin (2002) – Faroe Islands = 16,203 feet
  35. Clem Jones (2010) – Brisbane, Australia = 15,744 feet
  36. Maracaibo Fixed Link 2 (?) – Maracaibo, Venezuela = 14,436 feet
  37. Mastrafjord (1992) – Norway = 14,511 feet
  38. Valderoy (1987) – Norway = 13,848 feet
  39. Xiamen Xiang’an (2010) – Xiamen, China = 13,780 feet
  40. Lower Thames (prop) – London/Gravesend, UK 13,728 feet
  41. Halsnoy (2008) – Norway = 13,514 feet
  42. Drogden/Oresund (2000) – Copenhagen/Malmo, Denmark/Sweden = 13,287 feet
  43. Port Said I (2019) – Port Said, Egypt = 12,894 feet
  44. Port Said II (2019) – Suez, Egypt – 12,894 feet
  45. Godoy (1988) – Norway = 12,608 feet
  46. Hvaler (1989) – Norway  = 12,303 feet
  47. Wuhan-Changjiang (2008) – Wuhan, China = 11,838 feet
  48. Ellingsoy (1987) – Norway = 11,546 feet
  49. Tromsoysund (1994) – Norway = 11,480 feet
  50. Kanmon (1958) – Japan = 11,352 feet
  51. Genoa (2029) – Genoa, Italy = 11,155 feet
  52. Ibestad (2000) – Norway = 11,139 feet
  53. Eastern Harbour Crossing (1989) – Hong Kong, China = 11,088 feet
  54. Eurasia (2016) – Istanbul, Turkey = 10,958 feet
  55. Sloverfjord (1997) – Norway = 10,945 feet
  56. Elbe (1975) – Hamburg, Germany = 10,939 feet
  57. Bangabondu Sheikh Mugabur Rahman (2023) – Chittagong, Bangladesh = 10,892 feet
  58. Koje-do  (2009) – Busan, South Korea = 10,824 feet
  59. Queensway (1934) – Liverpool, United Kingdom = 10,630 feet
  60. Musko (1964) – Sweden = 9,709 feet
  61. Vardo (1982) – Norway = 9,479 feet
  62. Sydney Harbour (1992) – Sydney, NSW, Australia = 9,187 feet
  63. Changjiang Road (2015) – Shanghai, China = 9,187 feet
  64. Brooklyn-Battery (1950) – New York City, NY = 9,117 feet
  65. Holland (1927) – New York City, NY/NJ, USA = 8,557 feet
  66. Ted Williams (1995) – Boston, MA, USA = 8,448 feet
  67. Lincoln (1945/1957) = New York City, NY/NJ, USA = 8,216 feet
  68. Thimble Shoal Channel (1964) – Hampton Roads, VA, USA = 8,187 feet
  69. New Hampton Roads (2027) – Hampton Roads, VA, USA = 8,000 feet
  70. Chesapeake Channel (1964) – Hampton Roads, VA, USA = 7,941 feet
  71. Fort McHenry (1985) – Baltimore, MD, USA = 7,920 feet
  72. Kingsway (1971) – Liverpool, United Kingdom = 7,874 feet
  73. Waterview (2017) – Auckland, NZ = 7,874 feet
  74. Hampton Roads (1957) – Hampton Roads, VA, USA = 7,479 feet
  75. Baltimore Harbor (1957) – Baltimore, MD, USA = 7,392 feet
  76. Guadalquivir I (prop) – Seville, Spain = 7,172 feet
  77. Coastal Road (2023) – Mumbai, India = 6,791 feet
  78. Ring Road/Gulf (2011) – St. Petersburg, Russia – 6,562 feet
  79. Western Harbour (1997) – Hong Kong, China = 6,498 feet
  80. Queens Midtown (1940) – New York City, NY, USA = 6,414 feet
  81. Guadalquivir II (prop) – Seville, Spain = 6,251 feet
  82. Piet Hein (1997) – Amsterdam, Netherlands = 6,234 feet
  83. Cross Harbour (1972) – Hong Kong, China = 6,103 feet
  84. Sumner (1934) – Boston, MA, USA = 5,653 feet
  85. Tyne (1967/2011) – Newcastle, United Kingdom = 5,500 feet
  86. Ij (1968) – Amsterdam, Netherlands = 5,369 feet
  87. Ahmed Hamdi (1981) – Egypt = 5,348 feet
  88. Louis-Hippolyte Lafontaine – Montreal, QC, Canada = 5,280 feet
  89. Orlovski (2016) – St. Petersburg, Russia = 5,250 feet
  90. Weser (2004) – Bremerhaven, Germany = 5,250 feet
  91. Aktio–Preveza Undersea – Aktio, Greece (2002) = 5,165 feet
  92. Detroit-Windsor (1930) – Detroit, MI/ON, USA/Canada = 5,160 feet
  93. Callahan (1961) – Boston, MA, USA = 5,070 feet
  94. Monitor-Merrimac Memorial (1992) – Hampton Roads, VA, USA = 4,800 feet
  95. Vistula (2015) – Gdansk, Poland = 4,921 feet
  96. Silvertown (2025) – London, UK = 4593 feet
  97. Maas (1942) – Rotterdam, Netherlands = 4,517 feet
  98. Liefkenshoek (1991) – Antwerp, Belgium = 4,488 feet
  99. Blackwall (west) (1897) – London, United Kingdom = 4,440 feet
  100. Coen (1966/2013) – Amsterdam, Netherlands = 4,221 feet
  101. Port Miami (2014) – Miami, FL, USA = 4,200 feet
  102. Midtown (1962 ) – Hampton Roads, VA, USA = 4,194 feet
  103. Nord (1992) – Netherlands = 4,178 feet
  104. Sluiskil (2015) – Netherlands = 3,937 feet
  105. Blackwall (east) (1967) – London, United Kingdom = 3,852 feet
  106. Downtown (1952/1989) – Hampton Roads, VA, USA = 3,813/3,350 feet
  107. Washburn (1950) – Houston, TX, USA = 3,791 feet
  108. Coatzacoalcos (2017) Coatzacoalcos, Mexico = 3,590 feet
  109. Posey Tube (1928) – Oakland, CA, USA = 3,545 feet (Thank you, John)
  110. Bankhead (1941) – Mobile, AL, USA = 3,389 feet
  111. Webster Street Tube (1963) – Oakland, CA, USA = 3,350 feet (Thank you, John)
  112. Salamina Island – Perama (prop) – Greece = 3,281 feet
  113. George C. Wallace (1973) – Mobile, AL, USA = 3,000 feet
  114. Santos-Guaruja (uc) – Santos, Brazil = 2,854 feet
  115. Thorold (1967) – St. Catharines, ON, Canada = 2,756 feet
  116. Rostok (2003) – Rostock, Germany = 2,599 feet
  117. Kennedy (1969) – Antwerp, Belgium = 2,270 feet
  118. Massey (1959) – Vancouver, BC, Canada = 2,063 feet
  119. Nordhavnsvej (uc) – Copenhagen, Denmark = 2,034 feet
  120. Belle Chase (1956) – New Orleans, LA, USA = 1,938 feet
  121. Gote (2017) – Gothenburg, Sweden – 1,645 feet
  122. Old Elbe/St. Pauli (1911) – Hamburg, Germany = 1,398 feet
  123. Fort Point Tunnels – (1994) – Boston, MA, USA = 1,083 feet
  124. Townline (1972) – Welland, ON, Canada = 1,080 feet
  125. Harvey (1957) – New Orleans, LA, USA = 1,080 feet
  126. East Main Street (1972) – Welland, ON, Canada = 1,000 feet +/-
  127. Central-Wan Chai (2015) – Hong Kong, China = 987 feet
  128. Houma (2013) – Houma, LA, USA = 960 feet (Thank you, John)
  129. Henry Kinney (1960) – Fort Lauderdale, FL, USA = 864 feet
  130. Melocheville (1957) – Melocheville, QC, Canada = 747 feet
  131. Saint Remi (1954) – Montreal, QC, Canada = 486 feet
  132. Houma (1961) – Houma, LA, USA = unknown

SOURCES:

Posted in Cars, cities, commerce, economic development, environment, geography, infrastructure, land use, Maps, planning, Statistics, transportation, Travel, tunnels, urban planning | Tagged , , , , , , , , , , , , | 9 Comments